Stop reacting to failures. Capture a registered baseline of every critical asset, re-scan on a cadence, and turn condition monitoring into a trend line you can forecast against. The longer we monitor, the sharper the trend ... so maintenance gets scheduled, not triggered by a surprise.
A registered, survey-grade record of each asset's true geometry, fixed to coordinates and elevations.
Enough history to model the trajectory. You can see where it’s heading, not just react to it.
An integrity history nobody can easily replace ... and the reason you keep the program.
Each module is a repeatable capture-and-trend program for a class of critical asset. Start with one, add more as the program proves out.
Lining wear and remaining thickness tracked across campaigns.
Shell distortion, edge and bottom settlement, API-653 style trending.
Shell ovality, axial alignment, and deformation per survey.
Bulge, growth, and cyclic deformation captured and trended.
Verticality, lean, and structural movement over time.
Settlement and displacement of racks, supports, and steel.
Liner abrasion trended toward the change-out.
We scan each asset to survey grade and register it to a fixed coordinate system ... the reference everything else is measured against.
Your engineers define the thresholds. We map each asset's condition against the limits that matter to you.
On a schedule that fits your turnarounds, we re-capture and compare against the baseline and every prior pass.
Every critical asset in the IQ Platform, each tracked over time, with the trend your reliability team can plan against.
Each re-scan is compared against the baseline and a true reference ... and the deviations that matter get mapped and quantified, not eyeballed.
Tank bottom and edge settlement, foundation movement, and out-of-plumb lean ... the geometry an API-653 style assessment leans on.
Out-of-roundness, bulges, and flat spots measured against a true cylinder, shown as a deviation map.
Kiln and vessel ovality, axial alignment, and creep tracked survey to survey.
Lean and drift on stacks, flares, towers, and structural steel ... caught before it becomes a problem.
Refractory and lining wear trended across campaigns to inform your reline planning.
Color-mapped results and quantified reports your engineers can act on ... not just a pretty picture.
An AST survey is more than a settlement check. A single survey-grade capture gives you roof and floor deviation, high-definition shell alignment, peaking and banding, and shell and edge settlement ... plus the structural members and floating-roof geometry ... and the same point cloud certifies tank volume and supports spill-containment calculations. One scan answers every question at once, so project timelines tighten and the tank comes out of service less.
Bottom and roof deviation surfaces from one scan ... floor settlement and roof out-of-plane mapped in full, not spot-checked.
Edge and bottom settlement, out-of-roundness, and peaking and banding evaluated around the full circumference.
Shell verticality and nozzle alignment to survey grade, referenced to fixed control.
Column, girder, and rafter deflection on fixed-roof tanks, measured against the as-built datum.
Roof gap and rim-space analysis through the travel range ... the clearances that jam a roof and trip a seal.
Capacity and volume certification from the measured shell, plus dike and berm volumes for spill-containment calculations.
Risk-Based Inspection ranks each tank and vessel by probability of failure times consequence of failure, then lets inspection scope and intervals follow that risk ... the API 580 and 581 methodology, applied within API 653. Reality capture doesn't replace an RBI program. It feeds it ... the high-density geometry and the scan-over-scan trend that firm up the probability side, alongside the rest of your inspection toolkit.
Differential settlement and shell distortion are named tank damage mechanisms. We measure and trend them at survey grade, so the likelihood side of the risk score rests on data, not estimates.
The code inspection clock is slow and built around a shutdown ... external every five years, internal up to twenty. We scan in service on a faster cadence ... annual or semi-annual ... so condition is a visible trend between inspections. Read with your floor MFL and UT, that measured trend is the evidence an RBI assessment uses to stretch a low-risk tank toward its interval limit and pull a moving one forward before it surprises you.
Risk drifts as assets move. Each re-scan refreshes the geometry inputs with current data, so the assessment stays live between turnarounds instead of aging out the day it's filed.
Reality capture is one input among several. It complements ultrasonic wall-thickness readings, magnetic-flux floor scanning, and visual NDE ... it doesn't stand in for them. We own the geometry and the trend; your inspectors and integrity engineers own the risk call and the plan.
A live, refractory-lined thermal oxidizer ... captured, sectioned, and compared to its as-built design to quantify lining wear before it became a failure.
LiDAR flythrough of the thermal oxidizer ... the unit behind this analysis
The same unit as a measurable point cloud ... 1.49 million in-service points. Findings mode paints the report's wear locations on the choke ring; Intensity shows the raw laser return.
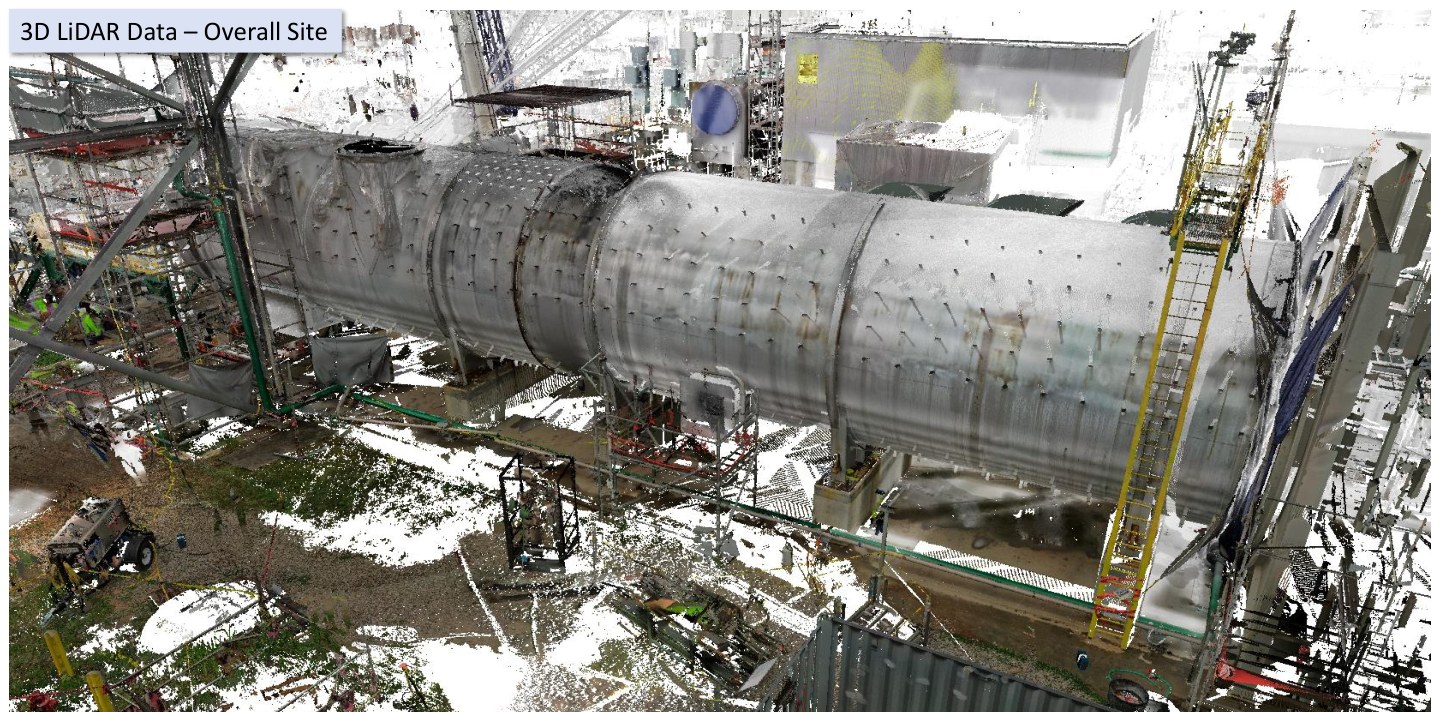
Survey-grade LiDAR of the full unit, on site and live ... the whole thermal oxidizer as a measurable point cloud.
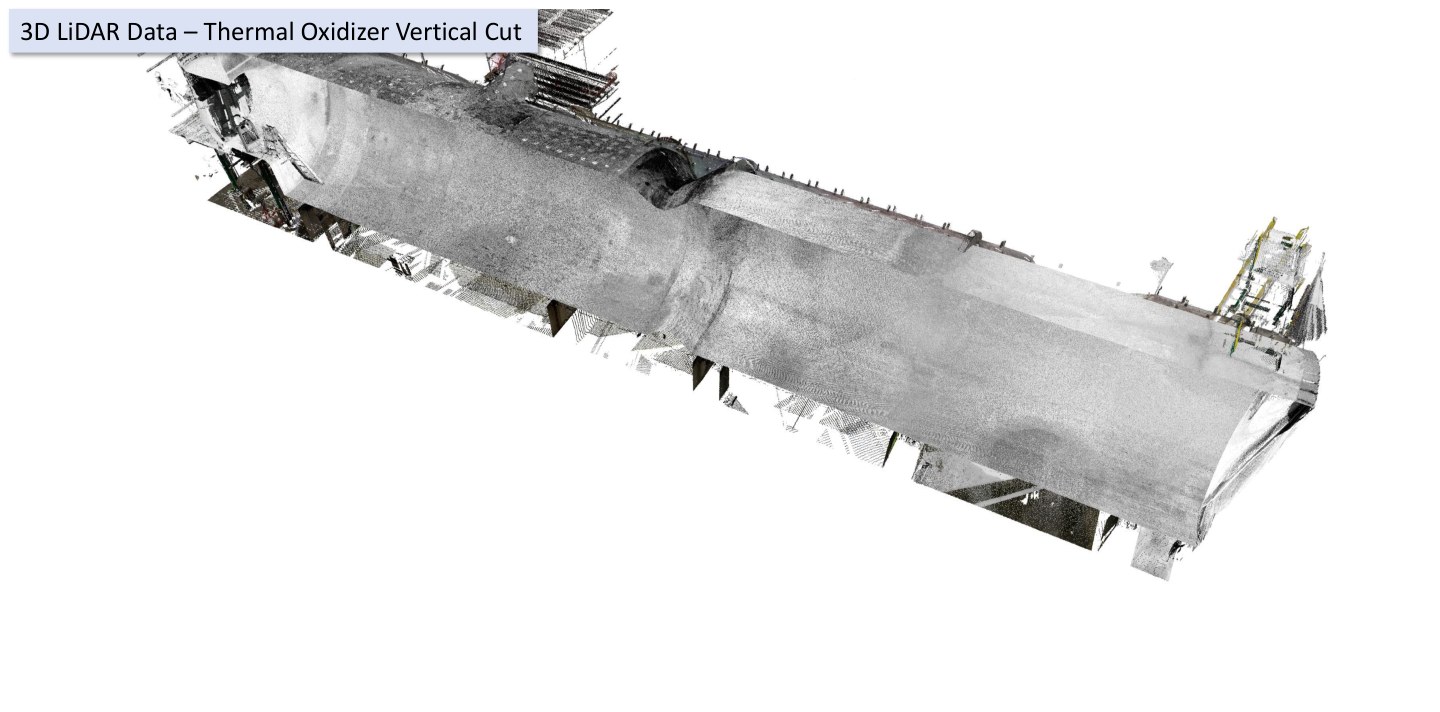
Horizontal and vertical cuts through the cloud isolate the refractory choke ring for analysis.
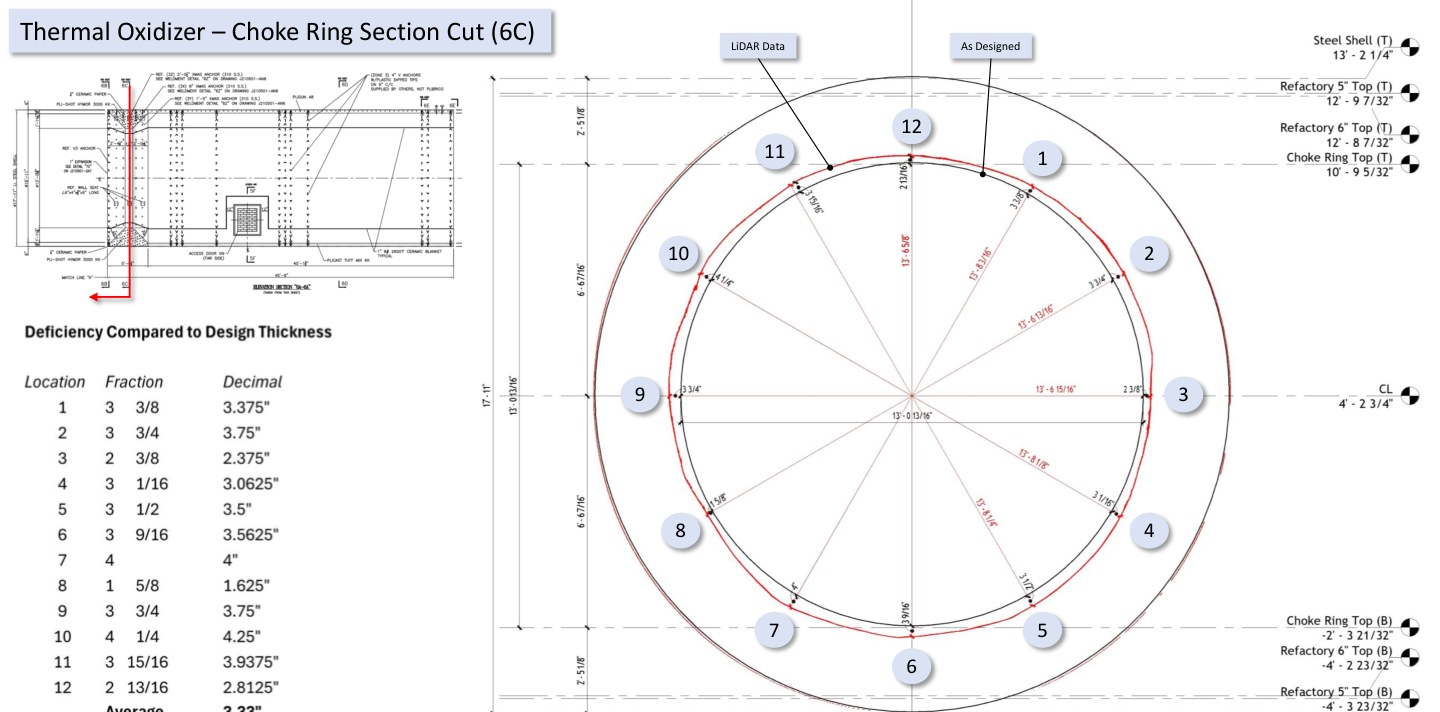
The ring is sliced at twelve positions around the clock, each measured independently.
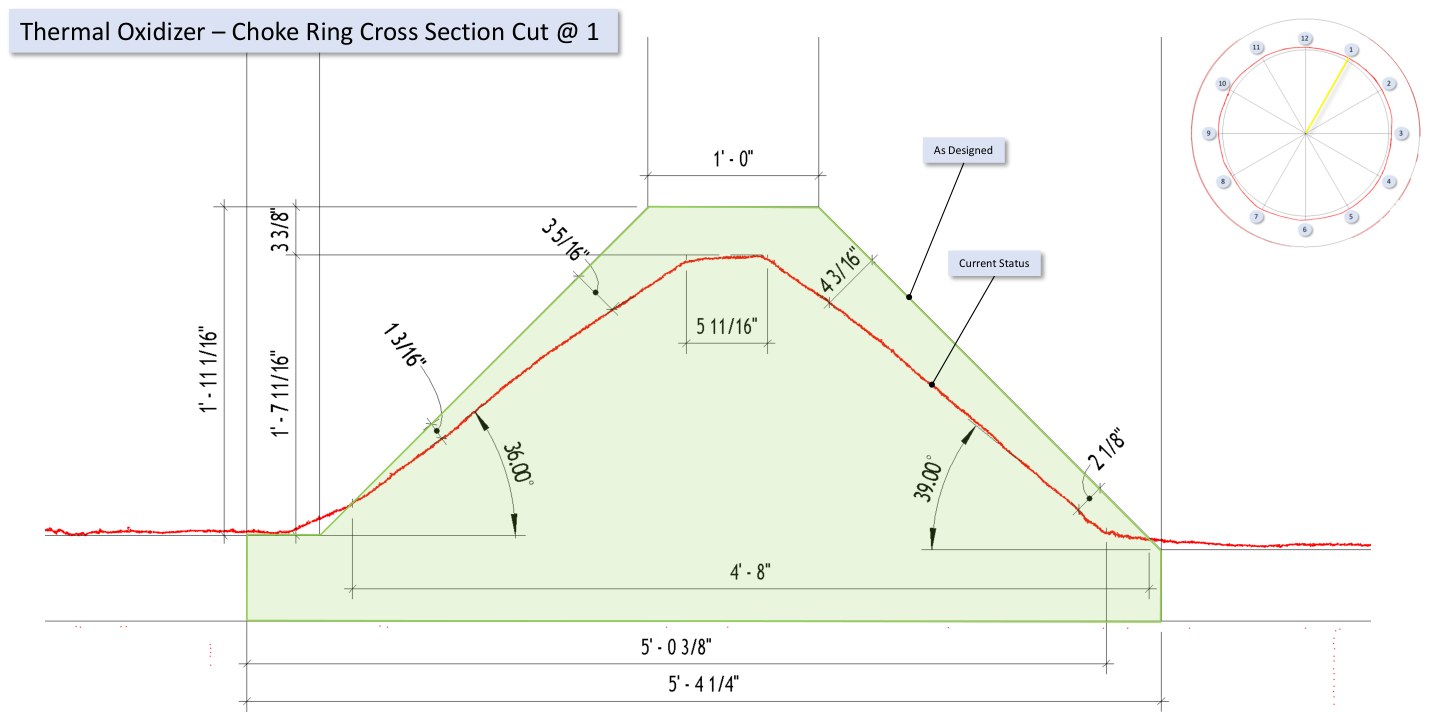
The scanned profile (red) overlays the as-designed (green). Lining loss is measured at every cut ... the measured basis your engineers need for a reline decision, not a guess.
A single scan tells you the condition today. Monitoring tells you the trajectory. Hold a fixed baseline, re-scan on a cadence, and condition becomes a trend you can forecast against ... a record that only gets more valuable over time.
No ... it strengthens it. Scanning captures the geometry side (settlement, deformation, ovality, verticality) at high density and feeds your existing program. We work alongside your inspectors and engineers, not instead of them.
RBI scores each asset by probability times consequence of failure (API 580 / 581) and sets inspection scope and intervals under API 653. We supply one input ... the measured geometry and its trend ... settlement, distortion, ovality, verticality ... which firms up the probability side and gives you a defensible basis to optimize intervals. It complements ultrasonic thickness, floor MFL, and visual NDE; your integrity engineers keep the risk call.
Annually for most assets, semi-annually for ones that are moving ... deliberately more often than the API 653 inspection clock, because the two are different things. The code sets when a tank is formally inspected (external every five years, internal up to twenty); our monitoring scan runs in between, in service, to catch movement early and grow the trend. That's what lets you walk into a turnaround already knowing what you'll find ... and the documented basis to optimize the next inspection interval.
Survey-grade capture (about ±2mm) registered to fixed control, so every cycle compares like to like. Small, real movements show up above the noise.
Start with those. We'll baseline them, show you the trend view, and prove the program on your hardest case first.